
Cloud based monitoring platform for industrial aplications


Easy way to change dashboard by adding your own widgets
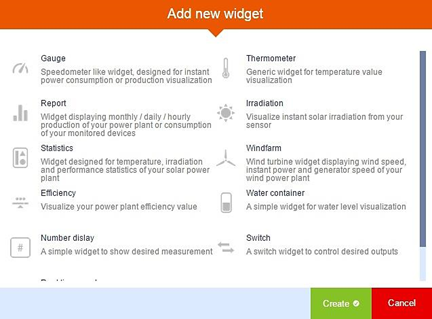
Dashboard consists of widgets. All widgets are easy to change and add according to your own needs.
You can add a new widget by doing these steps:
Widget configuration example
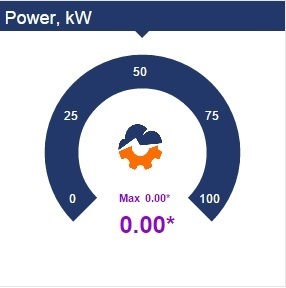
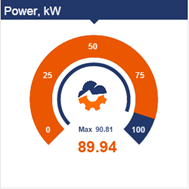
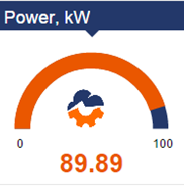
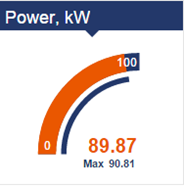
Gauge widget
This widget is made to show current value and today’s maximum value.
General tab:
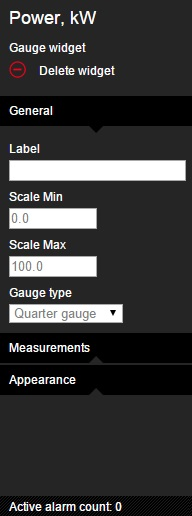
Gauge type – 3 possible types:
2. Half gauge
3. Quarter gauge
Measurements tab:
In the measurement tab, you can add more measurements – select tags from other data loggers, change text or numbers format, etc.
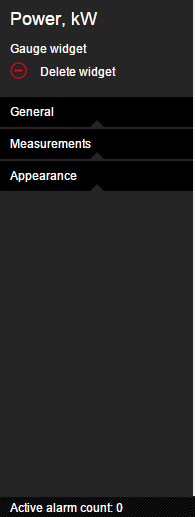
Appearance tab:
In the appearance tab, you can adjust animation time, animation steps (choppy or smooth), also, you can choose background, foreground, small bar and scale colors.
Graphical visualisation of technical process
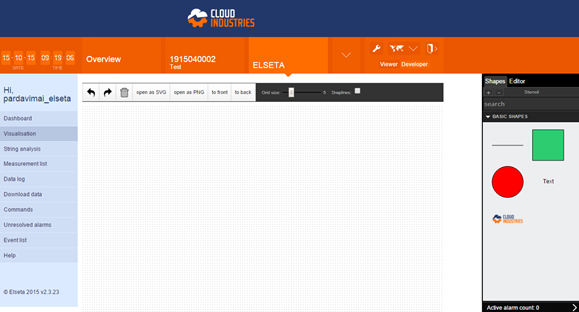
CloudIndustries.eu features tool allows to draw or upload graphical visualisation with active real time data. The powerful feature enables users to easily create a graphical layout of their remote installation.
Application window
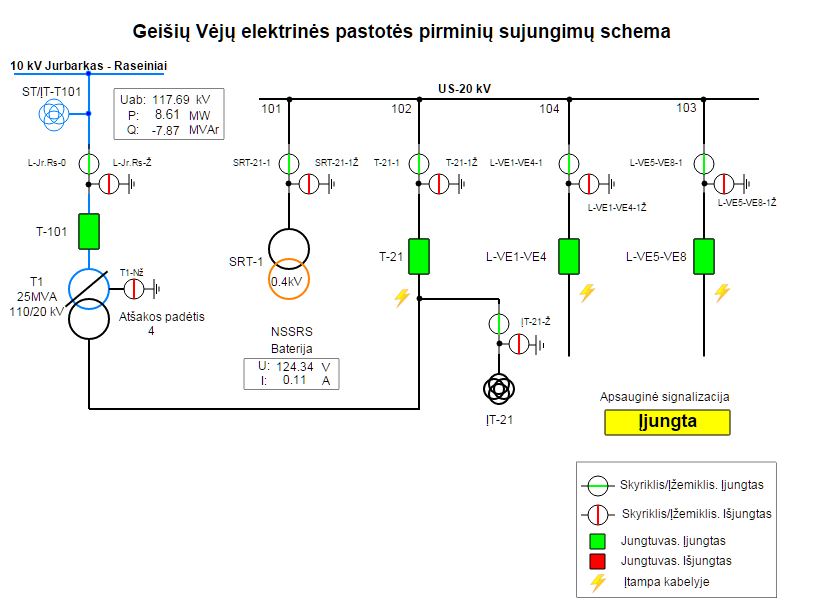
Users can draw or upload graphical visualisation with active real time data and easily create a graphical layout of their remote installation. Users can add images, such as analog and digital graphical components (gauges, meters, indicators, etc.) to display a visual layout that is easy to understand.
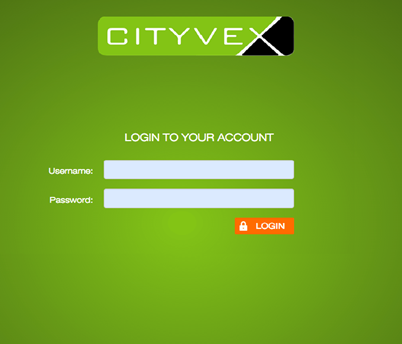
Branding opportunity
Customization of WEB interface services allows to adapt cloudindustries.eu platform (including the login page and the dashboard) to user wishes and their own branding.
One of the examples is how cloudindustries.eu adapted a platform for the heat pump solution “Cityvex” for apartment buildings.